SWick

Sysadmin-by-Nature

Entries tagged "monitoring".

Python script for Nagios to monitor SQL Server 2005 database mirroring
16th March 2009

Python Port of a Perl script I uploaded to NagiosExchange last year.

The script should be run on the PRINCIPAL with a read-only user. If you want to run it on the MIRROR, the user must have the Sysadmin role on it (ask Microsoft for the reason). Otherwise you get NULL.

You have to install the module pymssql manually if it's not shipped with your distro.

#!/usr/bin/python

import optparse
import pymssql
import sys

def main():

    #Connect to MSSQL Server
    try:
        con = pymssql.connect(host=host, user=user, password=password, database=database)
        cur = con.cursor()

    except TypeError:
        print 
        print "Could not connect to SQL Server"
        print 
        sys.exit(1)

    # Execute Query which checks if database is mirrored
    query="""SELECT d.name, m.mirroring_role_desc, m.mirroring_state_desc
             FROM sys.database_mirroring m
             JOIN sys.databases d ON m.database_id = d.database_id
             WHERE mirroring_state_desc IS NOT NULL AND name = """ + "'" + database + "'"

    cur.execute(query)

    results = cur.fetchall()

    for row in results:
        name  = row[0]
        role  = row[1]
        state = row[2]

    exit_val = 2

    if cur.rowcount > 0:
        if (role == "PRINCIPAL") and (state == "SYNCHRONIZED"):
            exit_val = 0

    if exit_val == 0:
        print "OK", "-", name, "-", role, "-", state
    else:
        print "CRITICAL - Check the mirrored database"

    con.close()


if __name__ == "__main__":

    # Command line Options
    parser = optparse.OptionParser()

    parser.add_option("-H", "--host",     dest="host",     metavar="HOST", help="IP or hostname with the mirrored database")
    parser.add_option("-d", "--database", dest="database", metavar="DB",   help="Name of the mirrored database")
    parser.add_option("-u", "--user",     dest="user",     metavar="USER", help="User to login")
    parser.add_option("-p", "--password", dest="password", metavar="PW",   help="Password of the user")

    if (len(sys.argv) < 2):
        args=["-h"]
        (options, args) = parser.parse_args(args)

    (options, args) = parser.parse_args()

    host     = options.host
    user     = options.user
    password = options.password
    database = options.database

    # Main function 
    main()
Tags: db, monitoring, mssql, python.
Monitoring IPVS in OpenNMS with Net-SNMP and Python
11th March 2010

I tried using the existing Net-SNMP Module but had no immediate success. To use it under 64-Bit systems, you have to change the Makefile. But even after that I only got zeros when walking the snmp tree. So then, I decided going for Python :-)

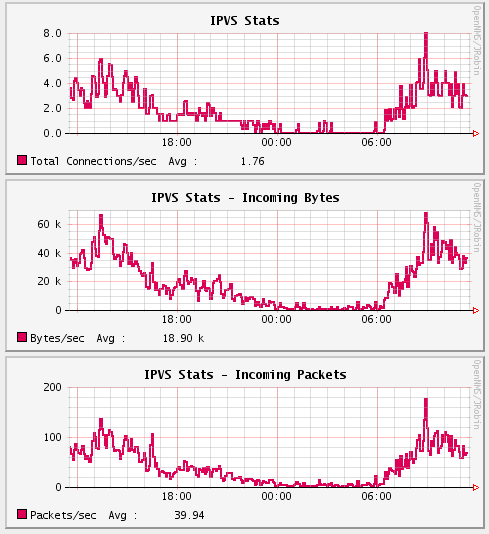
This is how it will look like:

First, our Python script getting the values. Deploy it on your load-balancer running IPVS and make it executable with chmod +x /opt/ipvs_stats.py.

/opt/ipvs_stats.py

#!/usr/bin/env python

import sys

filename = "/proc/net/ip_vs_stats"

try:
    f = open(filename,'r')

except IOError:
    print "Sorry, could not read file " + "'" + filename + "'"
    sys.exit()

data = f.read()


def hex2dec(s):
    """return the integer value of a hexadecimal string s"""
    return int(s, 16)

# first create a list of lists
data_list = [line.split()  for line in data.split('\n')]

stats = {}

stats['total_conns_sec']    = hex2dec(data_list[5][0])
stats['incoming_pkts_sec']  = hex2dec(data_list[5][1])
stats['outgoing_pkts_sec']  = hex2dec(data_list[5][2])
stats['incoming_bytes_sec'] = hex2dec(data_list[5][3])
stats['outgoing_bytes_sec'] = hex2dec(data_list[5][4])

if __name__ == '__main__':

    if len(sys.argv) < 2:
        print "\nError:\tNo arguments given.\n"
        print "Try:"

        for argument in stats:
            print "\t", sys.argv[0], argument
        sys.exit()


    if sys.argv[1] == 'total_conns_sec':
        print stats['total_conns_sec']

    if sys.argv[1] == 'incoming_pkts_sec':
        print stats['incoming_pkts_sec']

    if sys.argv[1] == 'outgoing_pkts_sec':
        print stats['outgoing_pkts_sec']

    if sys.argv[1] == 'incoming_bytes_sec':
        print stats['incoming_bytes_sec']

    if sys.argv[1] == 'outgoing_bytes_sec':
        print stats['outgoing_bytes_sec']

The script reads the values from proc and as they are hexadecimal, we have a function for converting them to integers. The script can get you 5 values but in this HowTo I left out the Outgoing values because I don't use LVS-NAT in my setup. But you can simply add them from the examples here...

Next step is to prepare SNMPd with our script so we can get the stats via SNMP.

/etc/snmp/snmpd.conf

# Monitoring IPVS

extend total_conns_sec    /opt/ipvs_stats.py total_conns_sec
extend incoming_bytes_sec /opt/ipvs_stats.py incoming_bytes_sec
extend incoming_pkts_sec  /opt/ipvs_stats.py incoming_pkts_sec

You can test it with

snmpwalk -v 2c -c <community> <IP> nsExtendOutline
NET-SNMP-EXTEND-MIB::nsExtendOutLine."total_conns_sec".1 = STRING: 3
NET-SNMP-EXTEND-MIB::nsExtendOutLine."incoming_pkts_sec".1 = STRING: 62
NET-SNMP-EXTEND-MIB::nsExtendOutLine."incoming_bytes_sec".1 = STRING: 31928

As you can see, I use nsExtendOutline instead of nsExtendResult. The reason is, that our values are surely greater than 127 and most systems require the exit value to be in the range 0-127, and produce undefined results otherwise. Therefore in our script we don't use sys.exit() but print the values to STDOUT instead.

The OID is an ASCII representation of your chosen string after the "extend" command. To see it, use -On in your snmpwalk.

snmpwalk -On -v 2c -c <community> <IP> nsExtendOutline
.1.3.6.1.4.1.8072.1.3.2.4.1.2.15.116.111.116.97.108.95.99.111.110.110.115.95.115.101.99.1 = STRING: 4
.1.3.6.1.4.1.8072.1.3.2.4.1.2.17.105.110.99.111.109.105.110.103.95.112.107.116.115.95.115.101.99.1 = STRING: 74
.1.3.6.1.4.1.8072.1.3.2.4.1.2.18.105.110.99.111.109.105.110.103.95.98.121.116.101.115.95.115.101.99.1 = STRING: 33322

Now we can configure OpenNMS for collecting the data

/etc/opennms/datacollection-config.xml

...
...
...

      <group name="ipvs" ifType="ignore">
        <mibObj oid=".1.3.6.1.4.1.8072.1.3.2.4.1.2.15.116.111.116.97.108.95.99.111.110.110.115.95.115.101.99" 
                instance="1" alias="ipvsTotalConnsSec" type="octetstring" />
        <mibObj oid=".1.3.6.1.4.1.8072.1.3.2.4.1.2.17.105.110.99.111.109.105.110.103.95.112.107.116.115.95.115.101.99" 
                instance="1" alias="ipvsPktsSecIn" type="octetstring" />
        <mibObj oid=".1.3.6.1.4.1.8072.1.3.2.4.1.2.18.105.110.99.111.109.105.110.103.95.98.121.116.101.115.95.115.101.99" 
                instance="1" alias="ipvsBytesSecIn" type="octetstring" />
      </group>
...
...
...

      <systemDef name="Net-SNMP">
        <sysoidMask>.1.3.6.1.4.1.8072.3.</sysoidMask>
        <collect>
          <includeGroup>mib2-host-resources-system</includeGroup>
          <includeGroup>mib2-host-resources-memory</includeGroup>
          <includeGroup>mib2-X-interfaces</includeGroup>
          <includeGroup>net-snmp-disk</includeGroup>
          <includeGroup>openmanage-coolingdevices</includeGroup>
          <includeGroup>openmanage-temperatureprobe</includeGroup>
          <includeGroup>openmanage-powerusage</includeGroup>
          <includeGroup>ucd-loadavg</includeGroup>
          <includeGroup>ucd-memory</includeGroup>
          <includeGroup>ucd-sysstat</includeGroup>
          <includeGroup>ucd-sysstat-raw</includeGroup>
          <includeGroup>ucd-sysstat-raw-more</includeGroup>
          <!-- <ipvs> -->
          <includeGroup>ipvs</includeGroup>
          <!-- </ipvs> -->
        </collect>
      </systemDef>
...
...
...

Note the type of "octetstring". If you look at the type of this OID from the walk above, you’ll see it is "string". RRDtool and JRobin can’t store string data, thus it needs to be converted to a number. Setting the type to "octetstring" causes this to happen (it is converted to a gauge).

And finally we can build pretty graphs out from it:

/etc/opennms/snmp-graph.properties

...
...
...

reports=...\
..., \
ipvs, ipvs.incoming.bytes, ipvs.incoming.packets \
...
...
...
report.ipvs.name=IPVS Stats
report.ipvs.columns=ipvsTotalConnsSec
report.ipvs.type=nodeSnmp
report.ipvs.command=--title="IPVS Stats" \
 DEF:totalconns={rrd1}:ipvsTotalConnsSec:AVERAGE \
 LINE2:totalconns#DE0056:"Total Connections/sec" \
 GPRINT:totalconns:AVERAGE:"Avg \\: %10.2lf %s" \

report.ipvs.incoming.bytes.name=IPVS Stats Incoming Bytes
report.ipvs.incoming.bytes.columns=ipvsBytesSecIn
report.ipvs.incoming.bytes.type=nodeSnmp
report.ipvs.incoming.bytes.command=--title="IPVS Stats - Incoming Bytes" \
 DEF:bytes={rrd1}:ipvsBytesSecIn:AVERAGE \
 LINE2:bytes#DE0056:"Bytes/sec" \
 GPRINT:bytes:AVERAGE:"Avg \\: %10.2lf %s" \

report.ipvs.incoming.packets.name=IPVS Stats Incoming Packets
report.ipvs.incoming.packets.columns=ipvsPktsSecIn
report.ipvs.incoming.packets.type=nodeSnmp
report.ipvs.incoming.packets.command=--title="IPVS Stats - Incoming Packets" \
 DEF:packets={rrd1}:ipvsPktsSecIn:AVERAGE \
 LINE2:packets#DE0056:"Packets/sec" \
 GPRINT:packets:AVERAGE:"Avg \\: %10.2lf %s" \

...
...
...
Tags: ipvs, monitoring, opennms, python.
OpenNMS - blank Resource Graphs page - 413 Requested entity too large
5th July 2014

If you have lots of performance graphs for a node in OpenNMS, sometimes you get a blank page showing them.

Especially when choosing a large time period like Last Month or Last Year.

The reason for a blank page is found in the OpenNMS logfiles.

"413 Requested entity too large"

Just increase the requestHeaderSize in /etc/opennms/opennms.properties until the graphs show up.

# This sets the request header size for jetty.
# The default value is 4000 bytes.
#org.opennms.netmgt.jetty.requestHeaderSize=4000
Tags: monitoring, opennms.
Monitoring stale NFS and CIFS shares with monit
17th July 2014

A good way to check if a network share like NFS or CIFS is still available, is to monitor an existing file on the share itself.

Doing this with SMB/CIFS is a little easier than with NFS when the NFS share is hard mounted.

The check would then wait forever if the NFS server is not available and not return any error. It could also happen that your checks are piling up in the process list.

Here is an example to make it work by using /usr/bin/timeout

timeout will run stat to check for the file but kill the stat command if it does not return within a specified time period.

For demonstration purposes I use monit but this can be done with any other monitoring solution like OpenNMS by executing the check over net-snmp's extend feature for example.

apt-get install monit

Monit Version >= 5.7

Since monit 5.7 "check program" supports now arguments.

/etc/monit/conf.d/cifs_nfs

check program CIFS with path "/usr/bin/timeout 1 /usr/bin/stat -t /media/cifs/test.txt"
  if status != 0 then alert

check program NFS with path "/usr/bin/timeout 1 /usr/bin/stat -t /media/nfs/test.txt"
  if status != 0 then alert

Monit Version < 5.7

With older versions of monit you have to use a wrapper script for the check.

mkdir /etc/monit/check_scripts/

/etc/monit/conf.d/cifs_nfs

check program CIFS with path "/etc/monit/check_scripts/check_stale_cifs.sh"
  if status != 0 then alert

check program NFS with path "/etc/monit/check_scripts/check_stale_nfs.sh"
  if status != 0 then alert

/etc/monit/check_scripts/check_stale_cifs.sh

#!/bin/bash

CHECK_FILE="/media/cifs/test.txt"
TIMEOUT=1

BIN_TIMEOUT=/usr/bin/timeout
BIN_STAT=/usr/bin/stat

"$BIN_TIMEOUT" "$TIMEOUT" "$BIN_STAT" -t "$CHECK_FILE" > /dev/null 2> /dev/null

RETVAL=$?

[ $RETVAL -eq 0   ] && echo "Ok. Found $CHECK_FILE" && exit $RETVAL
[ $RETVAL -eq 124 ] && echo "Timed out checking for $CHECK_FILE" >&2 && exit $RETVAL
[ $RETVAL -ne 0   ] && echo "Could not find $CHECK_FILE" >&2 && exit $RETVAL

/etc/monit/check_scripts/check_stale_nfs.sh

#!/bin/bash

CHECK_FILE="/media/nfs/test.txt"
TIMEOUT=1

BIN_TIMEOUT=/usr/bin/timeout
BIN_STAT=/usr/bin/stat

"$BIN_TIMEOUT" "$TIMEOUT" "$BIN_STAT" -t "$CHECK_FILE" > /dev/null 2> /dev/null

RETVAL=$?

[ $RETVAL -eq 0   ] && echo "Ok. Found $CHECK_FILE" && exit $RETVAL
[ $RETVAL -eq 124 ] && echo "Timed out checking for $CHECK_FILE" >&2 && exit $RETVAL
[ $RETVAL -ne 0   ] && echo "Could not find $CHECK_FILE" >&2 && exit $RETVAL
Tags: monit, monitoring.

RSS Feed

"People said I should accept the world. Bullshit! I don't accept the world." -- Stallman